Analysis · Bitcoin
Bitcoin below $70,000 came hours before the PPI, not after
The overnight low came about eight and a half hours before the 8:30 a.m. ET release, by Bitcoin Magazine's timing. How much liquidations and ETF redemptions added is not established.
By Phil5 min read

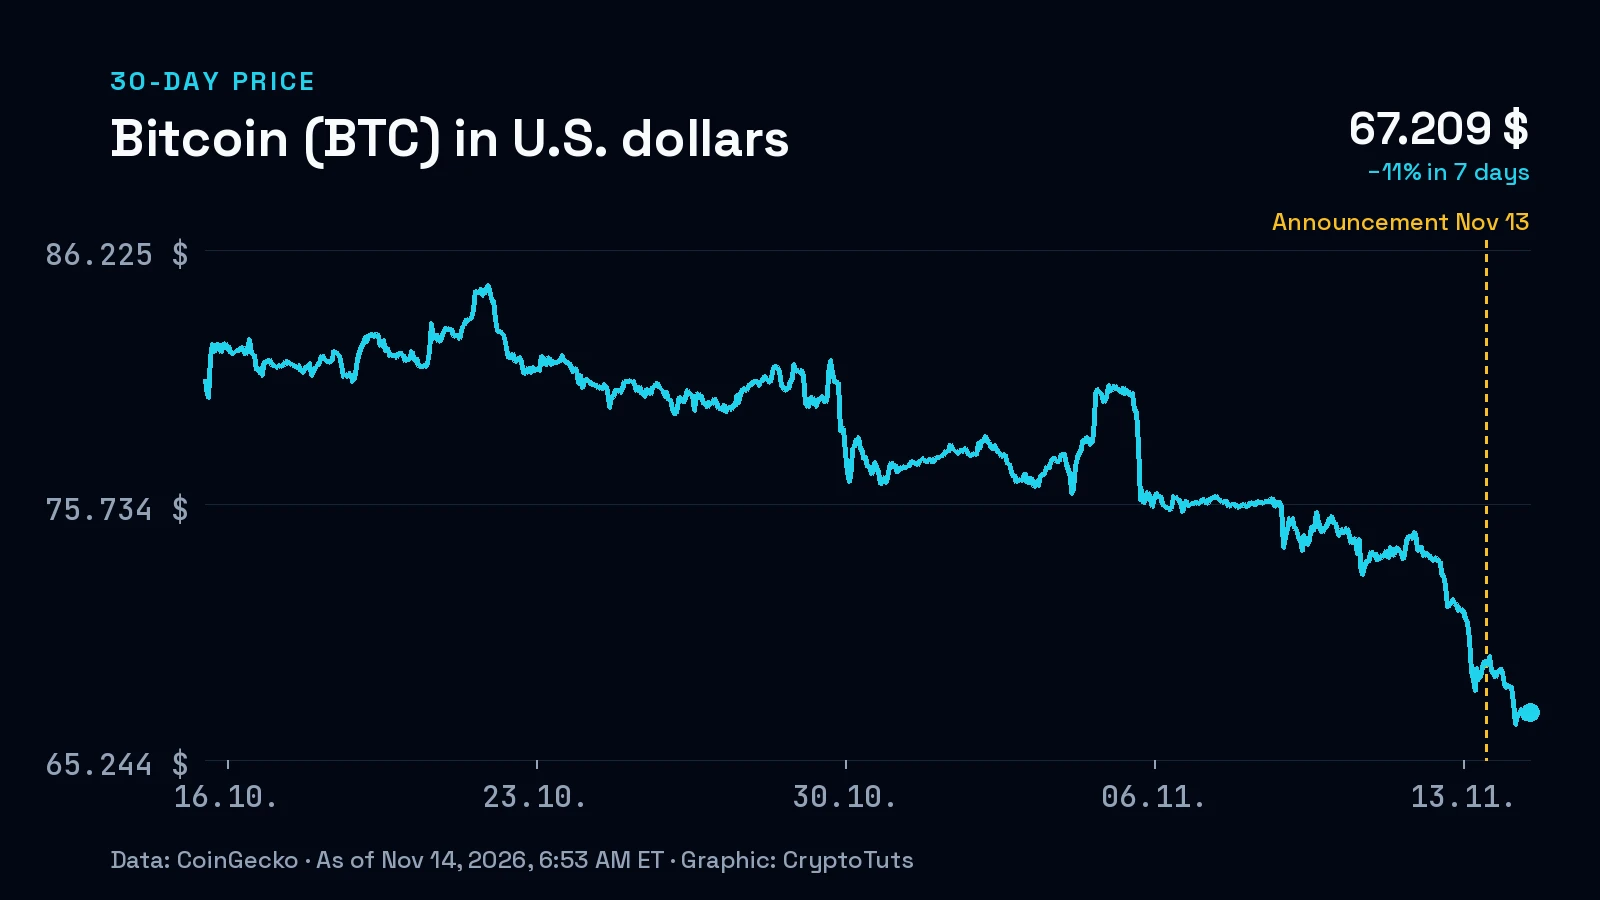
Bitcoin broke below $70,000 on the night of Nov. 12 to 13 and slid under its 200-week moving average near $68,000, Bitcoin Magazine reported. That average tracks weekly prices over almost four years. The overnight low came around midnight ET, roughly eight and a half hours before the Bureau of Labor Statistics published October producer prices at 8:30 a.m. ET. The break came first, and the data that arrived afterward showed producer inflation picking up speed.
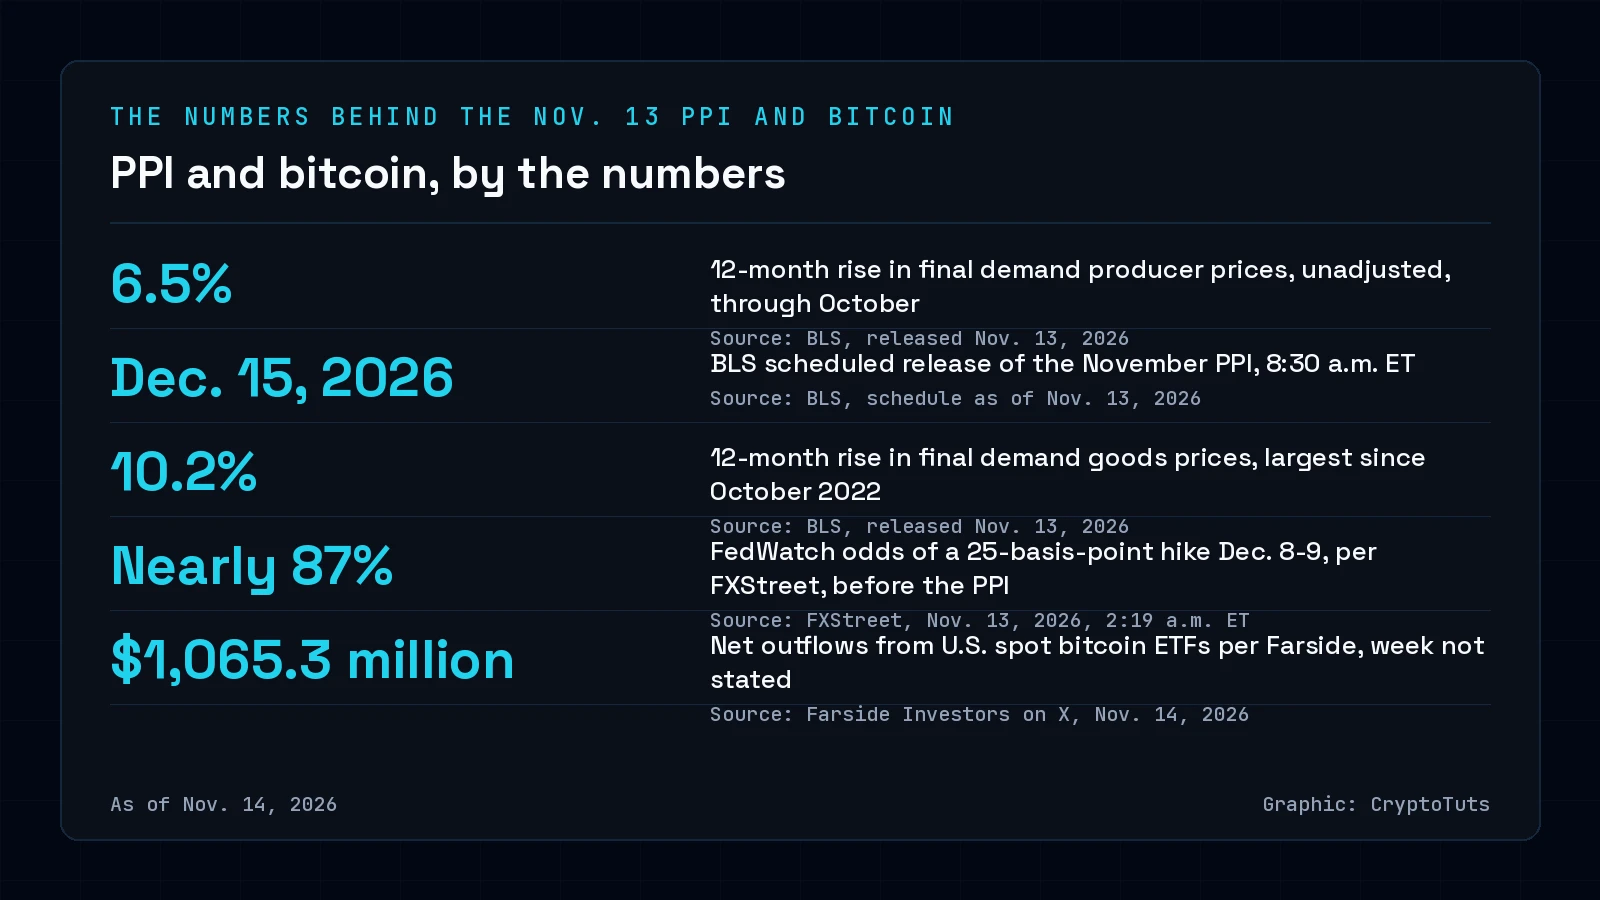
In the BLS release, final demand prices rose 6.5% in the 12 months through October, unadjusted, up from a revised 6.3% in September. That is the largest 12-month rise since November 2022, when the rate reached 7.4%. The unadjusted 12-month rate compares October with a year earlier; the monthly changes below are seasonally adjusted and measure one month at a time.
For your position, the timing settles the first half of the question. The break came before the inflation data, so the PPI cannot be its trigger. Bitcoin Magazine reported bitcoin back near $69,800 on the morning of Nov. 13, after the release.
Producer inflation quickened despite a mild 0.3% month
On the month, the October PPI release looked mild. Final demand prices rose 0.3%, seasonally adjusted, after a revised 1.4% in September and 0.4% in August.
A narrower gauge ran hotter. BLS also publishes an index for final demand less foods, energy and trade services, which drops the most volatile categories and the margins wholesalers and retailers earn. It rose 0.5% in October, matching September, and 4.9% over 12 months.
Goods did most of the lifting. Goods prices rose 0.5% in October, and services prices rose 0.2%. Over 12 months, goods prices climbed 10.2%, the largest rise since October 2022.
Measured against forecasts, October looked soft. Economists had expected a 0.4% monthly rise, Bitcoin Magazine reported, so October came in a tenth of a point short. FXStreet, writing before the release, cited a 6.6% expectation for the 12-month rate, just above the 6.5% BLS reported. Measured against September, the 12-month rate went up.
Hike odds stood near 87% before the release
Rate bets were already high when the data landed. In a report published at 2:19 a.m. ET on Nov. 13, FXStreet cited CME FedWatch odds of nearly 87% for a 25-basis-point hike at the Fed's Dec. 8-9 meeting and 13.13% for a half-point move. CME Group derives these odds from 30-day fed funds futures prices. They show what traders pay for rather than what policymakers plan.
Fed officials had leaned the same way. Bitcoin Magazine reported New York Fed President John Williams saying on Thursday, Nov. 12, that inflation remains high and policymakers need to act further. In the same report, Governor Christopher Waller has added a 50-basis-point increase to the discussion. FXStreet carried his view that such an increase should be considered if core inflation stays elevated.
Two market moves ran alongside bitcoin's slide. Bitcoin Magazine reported the U.S. Dollar Index held above 103 on Nov. 13 after a three-day rally to its highest since April 2025. The same report put bitcoin's fall at 5.9% from Nov. 5 to Nov. 12, against a 6.4% gain for the Nasdaq 100. That gap opened in the week before the PPI release.
Liquidations and ETF outflows ran into the billions
A liquidation happens when an exchange closes a leveraged position because the trader's collateral no longer covers the loss. An X post by ICO Drops relaying CoinGlass data showed $1.23 billion liquidated in the 24 hours to 03:27 UTC on Nov. 13. Long bets on higher prices made up $1.09 billion of it. That snapshot ends at 10:27 p.m. ET on Nov. 12, about an hour and a half before the midnight low.
Farside Investors' weekly summary, posted on X on Nov. 14, lists net flows of minus $1,065.3 million for U.S. spot bitcoin ETFs, meaning redemptions exceeded new money. BlackRock's iShares Bitcoin Trust (IBIT) accounts for minus $908.4 million, about 85% of the total, while MSBT took in $54.4 million. The summary leaves its week undated.
Bitcoin Magazine's flow figures run over longer windows. IBIT saw about $2 billion in outflows over nine sessions through Wednesday, Nov. 11. The U.S. spot bitcoin ETFs have flipped to about $1.56 billion in net outflows for 2026.
Tanay Ved, a senior research associate at Talos, told Bitcoin Magazine that thin liquidity and elevated leverage leave the market open to sharp moves in either direction.
Two December dates set the next test
The next rate signal comes from the Fed's Dec. 8-9 meeting. Before the PPI release, futures priced a 25-basis-point hike as the likely outcome.
BLS has scheduled the November PPI for Tuesday, Dec. 15, at 8:30 a.m. ET. That release shows whether the 12-month rate keeps climbing from 6.5%.
You can follow daily redemptions in the CryptoTuts spot bitcoin ETF flow tracker and prices after Nov. 13 on the CryptoTuts market heatmap.
Link disclosure: Sponsored module: Kalshi sponsors CryptoTuts, and we are compensated when readers sign up through the marked link (*). The reporting is independent of it. Read more
Sources
- Producer Price Indexes - October 2026 (USDL 26-1687) · U.S. Bureau of Labor Statistics
- Bitcoin Price Briefly Crashes to $67,500, Lowest Since August, as Dollar Holds 19-Month High · Bitcoin Magazine
- Dow Jones futures fall amid Fed rate hike fears, Nvidia leadership shakeup, PPI data eyed · FXStreet
- CME FedWatch Tool · CME Group
- X post by ICO Drops relaying CoinGlass liquidation data · ICO Drops
- X post by Farside Investors: Bitcoin ETF flow weekly summary · Farside Investors
About the author

Phil
Founder & Editor-in-Chief · In crypto since 2017
Phil is the founder of CryptoTuts and has explored Bitcoin, cryptocurrencies and blockchain technology since 2017. He explains complex topics clearly, with data and without empty promises.
- XRP and the XRPL
- Bitcoin
- Crypto tax records
- Exchange comparisons
- On-chain analysis